
Abstract
The impact of the two seismic events of August 24th 2016 on the municipality of Amatrice was highly destructive. There were 298 victims, 386 injured, about 5000 homeless, and the historical center of the town suffered a great number of partial and total collapses. The 260 strong motion records obtained for the first event were analyzed and plotted in a shakemap, comparing them with the macroseismic damage surveys made in 305 localities. On the basis of an inspection survey made in September 2016, a map of the damage patterns of the buildings in the historical center was elaborated according to the EMS 98 classification. The damage level resulted very high with more than 60% of the inspected buildings showing partial or total collapse. The elevated level of destruction was mainly caused by the high vulnerability of the masonry buildings, mostly due to specific vulnerability factors such as the poor quality of masonry, the lack of connections between walls and the poor connection between external walls and floors.
1 Introduction
The seismic events which hit Central Italy on August 24, October 26 and October 30 2016 have caused casualties and major damage mostly to buildings and architectural heritage of the Italian regions of Abruzzo, Lazio, Marche and Umbria. The mainshock occurred on August 24 at 3:36 am (local time) with epicenter close to Accumoli (Rieti province) and a magnitude Mw = 6.2; it was followed, at 4.33 am, by an aftershock with epicenter close to Norcia (Perugia province) and a magnitude Mw = 5.5. These events caused a total of 299 fatalities, 386 injured and about 4800 homeless (Italian Department of Civil Protection 2017). Most of the victims were in the areas of Amatrice, Accumoli, and Arquata del Tronto. In these municipalities heavy damage and collapse of residential buildings were reported.
On October 26, there were two strong aftershocks, the first at 19:10 with Mw 5.6 and the second at 21:18 with Mw 6.1. The earthquake of October 30, which happened at 7:40 am, had a MW 6.5, being the largest event in terms of released energy occurred in Italy since the Mw 6.9 1980 Irpinia earthquake.
The events of October 26 and 30 didn’t cause any victim thanks to the fact that people had been already evacuated from damaged and vulnerable houses after the previous seismic events. It has also to be considered that the October epicenters are located close to Norcia municipality (Fig. 1), where many buildings had been strengthened after the 1997 earthquake. Nevertheless, while the earthquake of August 24 had a very destructive impact on a restricted area included in the above listed municipalities, the impact of the following seismic events was distributed on a larger portion of territory extending northwards in the Marche Region. Many small towns and villages, which have survived to the first earthquake, were heavily damaged during the October 30 earthquake.

Seismicity of the area affected by the 2016 earthquakes: stars indicate earthquakes with Mw ≥ 5.5; red and purple areas the Monte Vettore and Monte della Laga faults; shaded rectangles the surface projection of ruptured faults; blue circles the historical earthquake epicenters, size-scaled with magnitude
This work has two main purposes: firstly it provides some new elaborations and comparisons regarding the seismic input and the damages in the area affected by the earthquake. The strong motion records of the Italian accelerometric network were analyzed and plotted in a shakemap making use of a G.I.S. framework and comparing them with the macroseismic damage surveys made in 305 localities. Furthermore the response spectra of the Amatrice recording station have been compared with the Italian Building Code for different return periods and with the more recent GMPEs.
The second scope of this work is to provide quantitative results about the damage in the historical center of Amatrice on the basis of a field survey. The damage to strategic structures such as hospitals and lifelines is not considered in this work, as it has to be studied by means of specific methods (Nuti et al. 2004; Rasulo et al. 2004). In the aftermath of the earthquake, several research groups performed field surveys, limited however to the southern part of Amatrice municipality (Santarsiero et al. 2016) or to RC buildings (Masi et al. 2016). The peculiarity of this work is that the authors had the possibility of visiting the historical center (red zone) of Amatrice in order to accurately evaluate the damage due to the August 24 earthquake. In fact, other works made on the basis of surveys done after the October 30 earthquake, had the problem of quantifying the cumulative damage due to multiple events. The results of the survey performed by the authors in September 2016, allowed to assess the damage level, collapse mechanisms and vulnerability factors of 240 buildings out of about 300 in the historical center. The damage level resulted very high: 44% of the inspected buildings had a total collapse and 19% a partial collapse. The elevated level of destruction was mainly due to the high vulnerability of the buildings, mostly made by cobblestone masonry. In the masonry structures, the presence of some vulnerability factors such as the lack of strong connections between walls, the poor connection between external masonry walls and floors and especially the inadequate quality of masonry, were the main causes of the activation of mostly out-of-plane collapse mechanisms.
2 Seismicity
Figure 1 shows the spatial distribution of the 5 epicenters with Mw ≥ 5.5 from August 24 to October 30. In the figure are also depicted the debated faults (Monte Vettore and Monti della Laga) reported in the Database of Individual Seismogenic Sources (DISS Working Group 2015; Galli et al. 2016), and the surface projection of the fault ruptures derived from SAR, GPS and seismometric data (Gruppo di lavoro INGV sul terremoto in Centro Italia 2016). Blue circles represent historical earthquakes, size-scaled with the magnitude according to the data contained in the Parametric Catalogue of Italian Earthquakes (Rovida et al. 2016).
2.1 Historical seismicity
The earthquakes that affected Central Italy in August and October 2016 are among the strongest events happened in that area. The maximum intensity assigned to the epicentral area after the August 24 earthquake (Galli et al. 2016) reached a value of X-XI in the scale Mercalli-Cancani-Sieberg (Sieberg 1930). An earthquake very similar to the 2016 one occurred in 1639 at only 4 km from Amatrice with the same magnitude (6.2) and a slightly lower MCS Intensity (IX-X).
Other strong earthquakes happened in Aquilano (MW 6.6, 1703) and in Valnerina (MW 6.0, 1730) at distances of about 26 km from Amatrice. The last important earthquake in this region was the 2009 L’Aquila earthquake (MW 6.3), with 309 victims, 1600 injured and about 60,000 homeless. The historical seismicity in Amatrice, in terms of MCS intensity, is reported in Fig. 2 starting from year 1500 A.D because, for the area of Amatrice and for intensities as high as 9, the historical catalogue can be considered complete only since year 1530 (Stucchi et al. 2004; Locati et al. 2016; DBMI15 2015).

Historical seismicity of Amatrice MCS Intensity (above VI degree) versus year of occurrence (Locati et al. 2016)
2.2 Strong motion records, shakemaps and macroseismic intensity
All the seismic events were recorded by a large number of strong-motion stations of the Italian accelerometric network (RAN), managed by the Department of Civil Protection. Table 1 shows, besides the number of recordings for the events with Mw ≥ 5.5 (http://esm.mi.ingv.it, Luzi et al. 2016), the main parameters of the selected events: date, origin time, geographical coordinates, focal depth, moment magnitude (EMSC—European Mediterranean Seismological Center, http://www.emsc-csem.org).
Figure 3 shows a comparison between the PGA of the largest of the two horizontal components of the 118 closest records obtained by the RAN stations (colors indicate the EC8 class site condition for each station), and the PGA evaluated by means of three different Ground Motion Prediction Equations (GMPE): SP96 (Sabetta and Pugliese 1996), AK14 (Akkar et al. 2014) and CF08 (Cauzzi and Faccioli 2008). CF08 and Ak14 were adjusted (multiplied by a factor of 1.16 according to PEGASOS 2004) in order to obtain the largest value of the horizontal component. The recorded values of PGA are generally higher than those predicted by the considered relations at short distances, and smaller at distances greater than 100 km. The scatter exceeds 1 standard deviation (SD) bound of Ak14 GMPE.

Comparison between 118 RAN strong motion records and most significative GMPEs for Italy in terms of PGA
Based on the strong motion time histories recorded by the RAN stations (http://ran.protezionecivile.it/IT/index.php), and INGV stations (http://ismd.mi.ingv.it), shakemaps of the geometrical mean of the two horizontal components of PGA, PGV, and spectral acceleration values have been implemented in a Geographical Information System (Quantum GIS Development Team 2017) drawing the “isolines” of the values recorded by the stations. In particular the Effective Peak Acceleration (EPA) has been calculated as the mean of the acceleration spectral ordinates in the period range 0.1–0.3 s divided by 2.5. This parameter has been considered a good damage indicator because, as reported in the next sections, almost 85% of the buildings in Amatrice have 2 or 3 floors. Figure 4 shows the comparison between the shakemap of EPA and the isoseismals calculated as interpolation of the MCS intensities evaluated in 305 localities in the macroseismic surveys performed after August 24 (Galli et al. 2016). It is worth noting that the majority of these localities are very small villages with few tens of inhabitants; among the 305 surveyed only 27 have an intensity above VIII MCS and 90 above VI, confirming that the damage is concentrated in a rather small area around the epicenter. The figure shows also the strong motion stations (blue triangles) together with the value of EPA, calculated for each station as said above (geometrical. mean of horizontal components).

Comparison between the isolines of the macroseismic intensity evaluated after the 24 August earthquake (Galli et al. 2016) and the geometrical mean of the horizontal components of the Effective Peak Acceleration (EPA) calculated as the mean of the spectral ordinates in the periods 0.1–0.3 s divided by 2.5 (RAN and INGV data)
The largest values of IMCS are concentrated in a rather restricted area around the epicenter. The highest damage was reported in the municipalities of Amatrice (AMT station) and Arquata del Tronto. The significant difference between the damage in Amatrice (IX-X MCS) and Norcia (VII MCS, NOR and NRC station) could be attributed to the different building characteristics (many of the buildings in the area of Norcia were strengthened after the Umbria-Marche 1997 earthquake). The differences in building stock vulnerability also explain the discrepancy between the isoseismal pattern, mainly oriented in N-S direction, and the ground motion pattern oriented in the NW–SE direction, according to the directivity effect of the causative fault (Fig. 4).
2.3 Amatrice strong motion record
The AMT accelerometric station is located in the municipality of Amatrice, 8.5 km far from the epicenter (Fig. 5). It is placed at approximately 450 meters from the town center (choosing the civic Tower of Amatrice as reference) and it lies at the base of the hill. Therefore there could be some differences with the ground motion on the hilltop. On the basis of microtremor H/V spectral ratio the station site is classified as EC8 soil class B* (ESM 2016).

Location and picture of AMT seismic station
The response spectra of the AMT station have been compared in Fig. 6 with the spectra of:

Comparison among response spectra of AMT station, Italian code spectra (RP = 475, 975 years) and deterministic spectrum (± σ) evaluated with Ak14 GMPE for MW = 6.2, epicentral distance Repi = 8.5 km and VS, 30 of 500 m/s; horizontal component (top); vertical component (bottom)
-
the Italian building code (NTC 2008, Vanzi et al. 2015) for two different return periods (Tr = 475 and 975 years) and soil class B.
-
the spectrum obtained from Ak14 GMPE, with MW = 6.2, epicentral distance Repi = 8.5 km and considering a VS,30 of 500 m/s.
The first observation that can be made is that the EW component of the AMT record more than doubled the PGA (0.87 vs. 0.37 g) and the maximum PSA (2.3 vs. 0.86 g) of the 975 years Italian code spectrum. The values at short periods are comparable to those derived from the Ak14 GMPE with the addition of 1 standard deviation. It is worth noting that the NS component shows much lower values with respect to EW component at short periods and higher values at periods larger than 0.5 s. It is possible to observe that, in the range of periods corresponding to the majority of buildings in Amatrice (0.1–0.3 s) the EW spectral acceleration is above 1.5 g.
The vertical component of AMT station exceeds the Italian code spectra for all the periods, reaching values up to 1 g, again more than double of the 975 years spectrum. It is important to highlight that the Italian code vertical spectrum does not take into account the different soil conditions, neither is thought for near field events.
3 Urban setting of Amatrice historical center
Amatrice suffered the most extensive damages caused by the August 24 earthquake, both in terms of human losses and damage to constructions. The town is located 955 m above sea level. in the Central Apennines; the municipality has an area of 174 km2 and a population of 2646 inhabitants, distributed between the historical center and the surrounding area. The urban composition of the historical center derives from the medieval structure of the city, within the former city walls. The city develops along the East–West direction with parallel streets and it is crossed by the main street Corso Umberto I, where many public and religious buildings are located.
The majority of the structures in the historical center of Amatrice are constituted by masonry building aggregates mainly made with cobblestones. This type of housing has typically wooden floors with span of about 4–5 m, while the vertical structure is formed by rubble stone masonry with poor connection between the external leaf and the core (absence of bondstones). Due to the weak structural connection between different buildings, these are more vulnerable to first mode damage mechanisms (Giuffré 1993).
Most used stones are limestones and sandstones, which were also used as aggregates in lime mortar, which has a poor binding capacity worsened by the presence of irregular smooth stones.
Isolated houses built in recent times have better construction quality, few RC frame buildings exist while there is no presence of steel buildings except one.
3.1 Previous damage assessments
To the authors knowledge, only two studies have been performed about the damage distribution in the Amatrice historical center after the earthquake of August 24. The map shown in Fig. 7 was elaborated from satellite images taken on August 25 (Project Copernicus 2017). The map constitutes a first evaluation of the damage in Amatrice made essentially for emergency management purposes. The main drawbacks are that the damage level is assigned to building blocks which include more than one building, and that the satellite photo neglects possible damage when the roof is not collapsed.

Map of damage in Amatrice from project Copernicus
Another damage map of Amatrice is that performed after the field survey done by GEER (Stewart et al. 2016). The shortcomings, in this case are that the survey has been performed along Corso Umberto (Fig. 8) only, with few buildings showing extensive damage D4 and D5 according to EMS 98 (Grünthal 1998) damage scale.

Map of damage in Amatrice from GEER report (Stewart et al. 2016)
4 Damage assessment, collapse mechanisms and vulnerability factors
The survey, done in Amatrice by the authors accompanied by a crew of the Italian Fire Brigades on September 12 2016, allowed to assess the damage and collapse mechanisms of 240 buildings out of about 300 in the historical center of the town. Due to the high risk related to the presence of debris on many streets and to falling material from damaged buildings it was not possible to map all the buildings. Moreover, the damage assessment was made by observing the buildings from the street only. The proposed methodology aims at defining the damage in the historical center of Amatrice caused by the earthquake of August 24, 2016, and relating this damage to damage mechanisms and to vulnerability factors of the observed buildings. The method was applied using QGIS software.
The procedure can be summarized as follows:
-
1.
Definition of single buildings: based on the cartographical data provided by project Copernicus, the geometries of blocks were subdivided into single units.
-
2.
Damage classification: based on the European Macroseismic Intensity Scale EMS 98, which defines six damage levels, from D0 (no damage) to D5 (total collapse), as depicted in Table 2.
Table 2 EMS 98 damage classification -
3.
Definition of damage mechanisms: the mechanisms were assigned both to reinforced concrete and masonry buildings as reported in the work of Zuccaro and Papa (2003) and are illustrated in Table 3 and Fig. 9, with their identification code.
Table 3 Selected damage mechanisms for Amatrice buildings Fig. 9 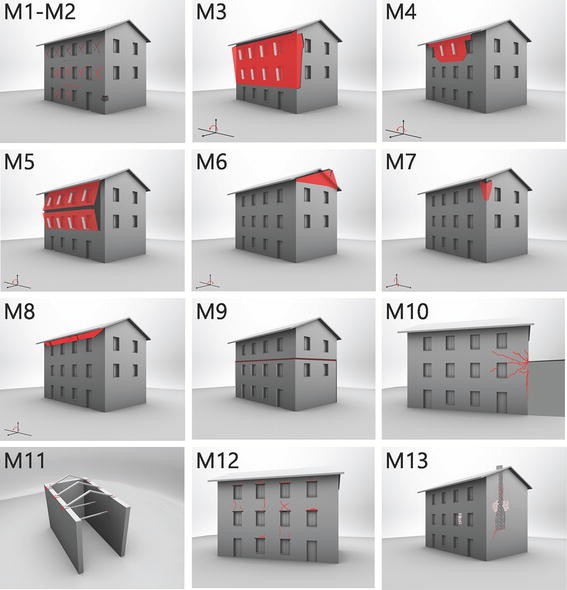
Schemes of damage mechanisms for masonry buildings (Pagano 2011)
-
4.
Vulnerability factors: the factors selected for masonry and reinforced concrete buildings are shown in Table 4.
Table 4 Vulnerability factors (causes of damage—weaknesses) -
5.
Assignment of damage levels: the observed level of damage was assigned to each inspected building, based on the survey and on the analysis of the photographic documentation.
-
6.
Comparison between damage/collapse mechanisms and vulnerability factors: among the different mechanisms that could have caused the damage of the building, the most relevant was chosen. Then, for each assigned mechanism, the vulnerability factor determining the damage or collapse was stated.

In summary the following parameters were assigned to each building:
-
1.
Structural materials (masonry, reinforced concrete, mixed RC-steel, and steel)
-
2.
Number of floors (including basement)
-
3.
Building use (residential, commercial, public building)
-
4.
Presence of tie rods or other retrofitting techniques.
-
5.
Damage level
-
6.
Main damage mechanism
-
7.
Vulnerability factors
The parameters assigned to the inspected buildings have been inserted into a QGIS map shown in Fig. 10. The main features of the map are the following:

Map of damage in Amatrice according to EMS-98 damage classification: The main mechanisms identified for each building are reported
-
the damage is assigned to single buildings, identified on the basis of the visual inspection;
-
the field survey allowed to assign a damage level taking into account the whole situation of the single building and not only the condition of the roof;
-
the map refers to the most probable damage mechanism only; a grey-scale-colored circle represents the type of mechanism: black circle for out-of-plane, grey circle for in-plane and white circle for local mechanism.
-
in case of total collapse (D5) it was impossible to assign a mechanism.
The observation of the map allows to make the following considerations: many of the buildings which suffered major damage or collapsed lied along Corso Umberto, where the majority of the historical buildings are located (32 collapses out of a total of 105); the majority of the collapses in Corso Umberto happened east of Via Roma, while in the west part of the town the damage seems to be more scattered (see Fig. 11).

Overview of damage on Corso Umberto: east (left) and west (right) of Via Roma
The field survey allowed to inspect a total of 240 buildings, the great majority of which (89%) are masonry buildings. RC buildings are 9% of the total, while the remaining buildings are mixed RC/masonry and steel structures. The building heritage of the historical center of Amatrice (Fig. 12) is mainly formed by 3 storeys (about 55%) and 2 storeys buildings (about 30%). As discussed previously, the prevalent structural period of these buildings ranges between 0.1 and 0.3 s.

Inspected buildings in Amatrice historical center—number of storeys
By analyzing the damage on the map and the results shown in Table 5 it is possible to count a 49% of D5 damage level and 19% of D4, so almost 70% of the damage is heavy. By observing the map, it is clear that the area located eastward of Via Roma has a larger percentage of D5. Bell Towers are included in the map and counted in the total number of buildings. Except for one case, bell towers suffered minor damage with respect to ordinary masonry buildings, probably due to the fact that they have larger vibration periods, thus suffering smaller spectral accelerations.
Many of the buildings inspected in Amatrice were provided with retrofitting systems, in particularly tie rods which constitute about 80% of the retrofitting interventions. Figure 13 shows the damage levels of masonry buildings without tie rods (grey bars), with any type of retrofitting system (yellow bars) and those who had only tie rods (black bars). The information was obtained by comparing the pictures of our survey with the images taken from Google Streetview©, dating to July and December 2011. It can be noted that many buildings which had tie rods suffered heavy damage and collapse, probably because in many cases the retrofitting had been made by means of inappropriate interventions, as depicted in Fig. 14. In fact, 31 out of 95 (32%) of the buildings which had a damage level D5 had been retrofitted with tie rods. For damage level D4 there are similar results: 10 out of 35 (29%) had tie rods.

Damage level of masonry buildings with and without tie rods

Partial facade collapse (mechanism M3) of a building which had tie rods: general view (left) and detail (right)
The most probable damage mechanism arises focusing on the 102 masonry buildings which have a damage level from D1 to D4 (from Table 1: 105 buildings—3 bell towers). In Fig. 15, for each damage level the number of buildings which had in-plane, out-of-plane and local collapse mechanisms is reported. For damage level D4 there were mainly out-of-plane mechanisms. In-plane mechanisms were identified mostly for damage levels D2 and D3, while local mechanisms are related mostly with levels D1-D2.

Damage mechanisms for masonry buildings and D1–D4 damage levels
Figure 16 compares the different damage mechanisms identifying the buildings with retrofitting and tie rods. Differently to what expected in a retrofitted building, it must be observed that, among the buildings which suffered damage mechanisms M3 and M4 (total or partial wall overturning), 9 out of 18 buildings had tie rods, thus allowing to state that the presence of tie rods did not prevent the activation of out-of-plane mechanisms, probably because of the poor masonry quality which did not allow an efficient force transfer system to the masonry.

Comparison between damage mechanisms and presence of tie rods for D1–D4 damage levels (see Table 3)
Figure 17 reports the vulnerability factors identified for 102 masonry buildings with damage level ranging from D1 to D4. The most relevant factors (more than 10 buildings affected) are:

Vulnerability factors identified for 102 masonry buildings and EMS 98 damage level
-
ev4: poor quality masonry (28%)
-
ev12: local discontinuities (21%)
-
ev1: lack of appropriate connection between walls (13%)
-
ev3: poor connection between floors and vertical structures (11%)
Examples of the first two vulnerability factors are reported in Figs. 18 and 19. The above listed factors represent almost 75% of the buildings with Damage level D1–D4. It is possible to notice that D4 is mainly connected with vulnerability factors ev1 (absence of walls connection), ev2 (absence of stringcourses), ev3 (floor/walls bad connection), ev4 (poor quality masonry) and only in few cases with ev5 (high percentage of openings), ev7 (variations at upper levels), ev9 (pushing roof structure), ev12 (local discontinuities).

Example of ev4 vulnerability factor (poor quality masonry): a absence of bondstones in the wall-section; b cobblestones with poor quality mortar

Example of ev12 vulnerability factor (local discontinuities): closure of previous wall openings (a), presence of weak wooden elements (b), presence of chimney in the wall (c)
The vulnerability factors connected with the out-of-plane overturning of a wall (i.e. ev1, ev2, and ev3) are those related to the highest level of damage D3 and D4. The poor quality masonry (ev4) and local discontinuities (ev12) characterize all the damage scale.
Figure 20 shows the type of damage mechanism (in-plane, out-of-plane, local) for each vulnerability factor.

Damage mechanism and vulnerability factors
It is worth noting that in plane mechanisms are only caused by ev5 (high percentage of openings), ev4 (poor masonry quality) and ev11 (local reduction of thickness). Out of plane mechanisms are due to ev1 (lack of connection between walls), ev2 (absence of stringcourses), ev9 (heavy roof), and partially to ev3 (connection wall-floors), ev4 (poor quality of masonry) and ev6 (contact with other buildings with different stiffness). Local failure mechanisms are due to ev7 (variation of the structural system at upper levels), ev8 (presence of staggered levels), ev10 (presence of lintel with reduced bending stiffness), ev12 (local discontinites), and ev6.
Reinforced concrete buildings represent only 9% of the building heritage in Amatrice. RC structures had a better response to the earthquake. In fact, about 57% of the buildings showed negligible to moderate damage (D0-D1-D2); 33% level D3 and only two RC buildings had respectively a damage level D4 and D5.
The most frequent type of damage for RC structures, as shown in Fig. 21, was the MD (cracks in infill panel) connected to the vulnerability factor evA (Table 4, frame with inadequate beams and infill walls). The Hotel Roma building, which was rated D4, presented a soft-storey mechanism and had been demolished at the date of our survey; therefore the damage level was assigned based on newspaper images.

RC buildings: correlation between damage mechanisms and damage levels for the 16 RC buildings with damage D1–D4
5 Examples of observed damage
5.1 Ordinary masonry buildings
Figure 22 shows the picture of a 3-floors masonry residential building located at the entrance of the town along the provincial road. The assigned damage level was D3 due to the in-plane cracking and partial detachment of the external walls. The visual inspection revealed: poor masonry quality and different types of masonry at various floors (irregular pattern stone masonry at the first floor, regular pattern brick masonry at the second floor); local discontinuities under the windows (hollow bricks); presence of RC roof and RC stringcourses; incipient overturning of the wall corner.

Residential masonry building: D3 damage level, in-plane cracking shear mechanism (M2), poor masonry vulnerability factor (ev4)
In Fig. 23 a 2-storeys masonry building, located in Via Madonna della Porta and which had a damage level D4 is depicted. The damage mechanism was an in-plane shear walls failure. The assigned vulnerability factors are: the poor quality of masonry, the presence of large openings realized in recent times, the presence of local discontinuities (recess and cracking in spandrel panels).

Residential masonry building: D4 damage level, shear failure of external walls mechanism (M1), poor masonry vulnerability factor (ev4)
Figure 24 shows a 3-storeys building which represents an example of a building rated with a damage level D5 (total collapse of the floor) in which the roof did not collapsed. In particular, it is possible to highlight the poor quality of masonry, the presence of discontinuities (chimney inserted in the spine wall), the presence of a collapsed arch at the basement, the overturning of external walls.

Residential masonry building: D5 damage level
5.2 Churches
Figure 25 shows the damage occurred to the fourteenth century church of S. Agostino, which was assigned to a D4 damage level. On the left, it is possible to notice the total collapse of the tympanum and the partial roof collapse. Moreover, on both sides of the façade it can be noted an in-plane cracking bringing to the detachment of the right corner of the façade. In the right part of the picture it is highlighted the overturning of the façade. This collapse mechanism is probably due to the lack of connections between elements. As in other churches in the area, the ruptures revealed the masonry type, a multileaf masonry with an inner core made of poor quality rounded stones with an external panel made of regular stones.

Church of S.Agostino: damage level D4, collapse of tympanum (M6) and in-plane cracking of façade (left); overturning of façade (M3, right), ev1 vulnerability factor
The church of S. Francesco, built at the end of the fifteenth century and depicted in Fig. 26 presents similar damages. It suffered the partial collapse of the tympanum and the partial collapse of the roof. There is a shear diagonal cracking on the façade and an overturning mechanism of the colonnade outside the church. It is worth noting that the collapse mechanism is the same of the church of S.Agostino.

Church of S.Francesco: damage level D4, collapse of tympanum (M6) and in-plane cracking of façade (left); collapse of columnade (right), ev1 vulnerability factor
5.3 RC buildings
In Fig. 27 a residential 5-storeys RC frame building is depicted. This building became a symbol of the city of Amatrice in the days after the earthquake because it was one of the few buildings that did not collapse in the eastern part of Corso Umberto. The picture shows in particular the failure of a beam-column node. A detail of the node shows also that the longitudinal rebars are external to the stirrups. The pictures show also the partial detachment of the infill brick panels, poorly connected to the RC frame.

Residential RC building (damage level D3): global damage (left), damage of beam-column node (center), particular of the node (right). Damage mechanism MC, vulnerability factor evD
6 Conclusions
Between August and October 2016 the area near Amatrice was hit by a strong seismic sequence, counting five events with MW ≥ 5.5. Three of these earthquakes occurred in October and two in August. The second shock of August 24 was however of smaller magnitude with respect to the first one (5.5 vs. 6.2) and at a larger distance from Amatrice. Therefore the field survey analyzed in this work and made in September, refers essentially to the damage caused by the first earthquake. Studies which describe data collected after October 30, inevitably include the cumulative damage due to the following shocks too.
For the August 24 earthquake, the strong motion record of Amatrice shows values which largely exceed the Italian code spectrum, both in terms of horizontal and vertical components, in the range of periods corresponding to 2–3 storeys buildings, which constitute the majority of the constructions in Amatrice. This fact partially contributes to the huge and extensive damage suffered by Amatrice buildings.
The event of August 24 was therefore very destructive for low rise buildings, though in a rather small area around the epicenter, where the highest levels of macroseismic intensity are concentrated. The comparison between damage, represented by the macroseismic surveys, and the ground motion, represented by the Effective Peak Acceleration has been done interpolating the data points in a G.I.S. and showed a good agreement. The spatial trend, extending to northwards for the intensity and to NW for the ground motion, resulted slightly different probably due to the different vulnerability of the building heritage.
On the basis of the field survey performed in Amatrice, a detailed map of the damage distribution due to the August 24 earthquake has been realized. The map shows a very high level of damage along the main street of the town, Corso Umberto. The damage survey allowed to identify the damage mechanisms and vulnerability factors both for masonry and RC buildings, thus obtaining a picture of the destructive effects of the earthquake in the historical center of the town and the explanation of the factors that lead to such a devastating result. A total of 240 buildings out of about 300 were inspected from outside. The damage level assigned was very high: 19% of the examined buildings showed a partial collapse (D4) and 44% a total collapse (D5).
Focusing on masonry structures, the majority of the inspected buildings had multileaf masonry walls, formed by two panels of irregular stones connected by poor quality mortar joints, filled with poorly cemented rubble stones and without bondstones connecting the inner and outer panels. The presence of specific vulnerability factors such as the lack of strong connections between walls, the poor connection between walls and floors and especially the inadequate quality of masonry, were the main causes of the activation of mainly out-of-plane collapse mechanisms. The result has been a weakening of the buildings bearing capacity bringing to partial or total collapse, despite the fact that about 40% of masonry buildings had steel tie rods or other retrofitting systems. Many of the strongly damaged buildings had been modified using reinforced concrete and many as well presented timber horizontal elements, showing both a detrimental effect in some cases and a useful contribution in others. Once more is confirmed the importance of good engineering evaluations in the design of interventions on existing buildings, which cannot simply be based on standard techniques, requiring a detailed evaluation of local and global structural behavior as well as of material assessment.
References
Akkar S, Sandıkkaya MA, Bommer JJ (2014) Empirical ground-motion models for point-and extended-source crustal earthquake scenarios in Europe and the Middle East. Bull Earthq Eng 12(1):359–387
Cauzzi C, Faccioli E (2008) Broadband (0.05–20 s) prediction of displacement response spectra based on worldwide digital records. J Seismol 12(4):453–475
Copernicus Emergency Management Service (2017) Retrieved March 14, 2017 from http://emergency.copernicus.eu/
DISS Working Group (2015) Database of Individual Seismogenic Sources (DISS), Version 3.2.0: a compilation of potential sources for earthquakes larger than M 5.5 in Italy and surrounding areas. http://diss.rm.ingv.it/diss/, ©INGV 2015—Istituto Nazionale di Geofisica e Vulcanologia—All rights reserved. https://doi.org/10.6092/INGV.IT-DISS3.2.0
Galli P, Peronace E, Bramerini F, Castenetto S, Naso G, Cassone F, Pallone F (2016) The MCS intensity distribution of the devastating 24 August 2016 earthquake in Central Italy (MW 6.2). Ann Geophys 59, Fast Track 5. https://doi.org/10.4401/ag-7287
Giuffré A (1993) Sicurezza e conservazione dei centri storici—Il caso Ortigia, Editori Laterza
Grünthal G (1998) European Macroseismic Scale 1998 (EMS-98). Center Europèen de Géodynamique et de Séismologie, Luxembourg
Gruppo di lavoro INGV sul terremoto in Centro Italia (2016) Rapporto di sintesi del terremoto del centro Italia. https://doi.org/10.5281/zenodo.166019
Italian Department of Civil Protection (2017) http://www.protezionecivile.gov.it/jcms/it/terremoto_centro_italia_2016.wp
Locati M, Camassi R, Rovida A, Ercolani E, Bernardini F, Castelli V, Caracciolo CH, Tertulliani A, Rossi A, Azzaro R, D’Amico S, Conte S, Rocchetti E (2016) DBMI15, the 2015 version of the Italian macroseismic database. Istituto Nazionale di Geofisica e Vulcanologia. https://doi.org/10.6092/INGV.IT-DBMI15
Luzi L, Puglia R, Russo E, ORFEUS WG5 (2016). Engineering strong motion database, version 1.0. Istituto Nazionale di Geofisica e Vulcanologia, Observatories & Research Facilities for European Seismology. https://doi.org/10.13127/ESM
Masi A, Santarsiero G, Chiauzzi L, Digrisolo A, Manfredi V, Prota A, Verderame GM, Ricci P, Del Gaudio C, Di Ludovico M, Cosenza E, Manfredi G, Moroni C, Dolce M (2016) Danni agli edifici in cemento armato di Amatrice in conseguenza del terremoto del 24 agosto 2016: considerazioni preliminari. In: Proceedings of GNGTS 2016 conference, Lecce 22–24 November 2016
Nuti C, Santini S, Vanzi I (2004) Damage, vulnerability and retrofitting strategies for the Molise hospital system following the 2002 Molise, Italy, earthquake. Earthq Spectra 20(S1):S285–S299
Pagano E (2011) Danno sismico, meccanismi di collasso e fattori di vulnerabilità: una procedura di calcolo per edifici in muratura, University of Naples Federico II
PEGASOS (2004) Probabilistic seismic hazard analysis for Swiss nuclear power plant sites. Final report volume 5. Wettingen
Quantum GIS Development Team (2017) Quantum GIS geographic information system. Open Source Geospatial Foundation Project. http://qgis.osgeo.org
Rasulo A, Goretti A, Nuti C (2004) Performance of lifelines during the 2002 Molise, Italy, earthquake. Earthq Spectra 20(S1):S301–S314
Rovida A, Locati M, Camassi R, Lolli B, Gasperini P (2016) Catalogo Parametrico dei Terremoti Italiani, versione CPTI15. Istituto Nazionale di Geofisica e Vulcanologia. https://doi.org/10.6092/INGV.IT-CPTI15
Sabetta F, Pugliese A (1996) Estimation of response spectra and simulation of non-stationary earthquake ground motion. Bull Seismol Soc Am 86(2):337–352
Santarsiero G, Chiauzzi L, Masi A (2016) Analisi del danneggiamento di edifici situati nella zona sud del comune di Amatrice: confronto pre e post sisma del 24/08/2016 (Report fotografico, Versione V2) (www.reluis.it)
Sieberg A (1930) Geologie der Erdbeben. Handbuch der Geophysik 2(4):552–555
Stewart JP et al (2016) Engineering reconnaissance of the 24 August 2016 M6.0 Central Italy Earthquake. Version 2. GEER Association Report No. GEER-050, November 22, 2016. https://doi.org/10.18118/G61S3Z
Stucchi M, Akinci A, Faccioli E, Gasperini P, Malagnini L, Meletti C, Montaldo V, Valensise G (2004) Mappa di Pericolosità sismica del territorio Nazionale. http://zonesismiche.mi.ingv.it/documenti/rapporto_conclusivo.pdf (in Italian)
Vanzi I, Marano GC, Monti G, Nuti C (2015) A synthetic formulation for the Italian seismic hazard and code implications for the seismic risk. Soil Dynam Earthq Eng 77:111–122
Zuccaro G, Papa F (2003) CD Multimediale MEDEA—Manuale di Esercitazione sul Danno Ed Agibilità per edifici ordinari in muratura. Ed. CAR Progetti s.r.l. per il Dip. Prot. Civ. Uff. SSN-Roma
Acknowledgements
The authors would like to acknowledge the Italian Fire Brigades which have accompanied our group during the field survey. Their help was essential for the good result of this work. The work has been supported by Reluis and the Italian Department of Civil Protection.
Author information
Authors and Affiliations
Corresponding author
Rights and permissions
Open Access This article is distributed under the terms of the Creative Commons Attribution 4.0 International License (http://creativecommons.org/licenses/by/4.0/), which permits unrestricted use, distribution, and reproduction in any medium, provided you give appropriate credit to the original author(s) and the source, provide a link to the Creative Commons license, and indicate if changes were made.
About this article

Cite this article
Fiorentino, G., Forte, A., Pagano, E. et al. Damage patterns in the town of Amatrice after August 24th 2016 Central Italy earthquakes. Bull Earthquake Eng 16, 1399–1423 (2018). https://doi.org/10.1007/s10518-017-0254-z
Received:
Accepted:
Published:
Issue Date:
DOI: https://doi.org/10.1007/s10518-017-0254-z